Time series analysis
Warning
These examples are out of date and may no longer work. Please refer first to the API Reference until the examples are updated.
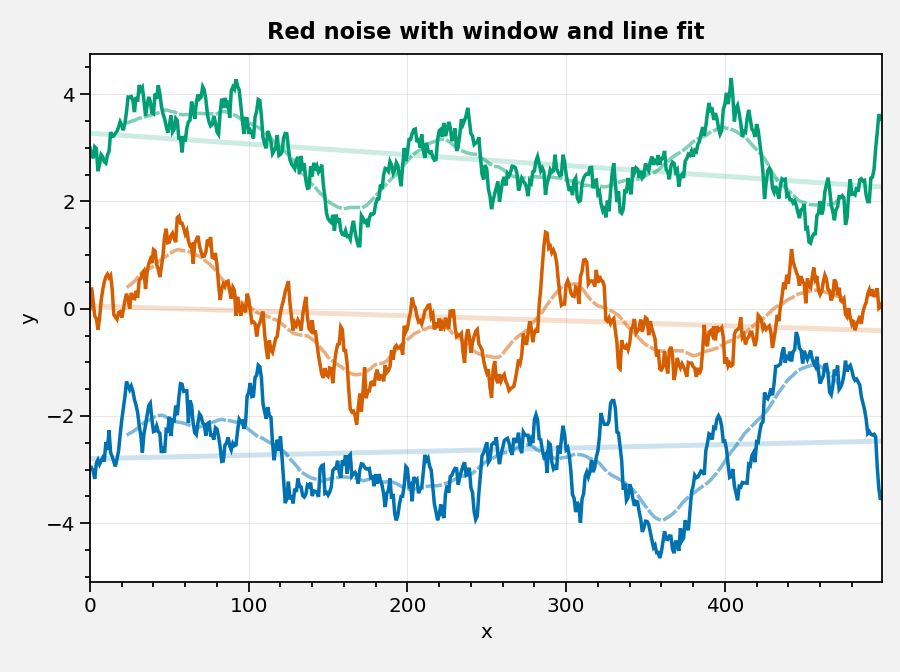
Trends and windows
Get the trend rate-of-change with the linefit function.
Get the actual best-fit line y-coordinates with using the build
keyword arg.
import proplot as plot
import climopy as climo
import numpy as np
plot.nbsetup()
d = climo.rednoise(500, 0.98, init=[-3,0,3], samples=3)
# d = climo.rednoise(500, 0.99, init=0, samples=[3,3])
r = climo.rolling(d, 50, axis=0, fillvalue=np.nan)
s = climo.linefit(d, axis=0, build=True)
# fit = climo.linefit(d, axis=0, stderr=True)
# l = climo.lanczos(30)
f, ax = plot.subplots()
for i in range(d.shape[1]):
    color = f'C{i}'
    h = ax.plot(d[:,i], color=color)
    h = ax.plot(r[:,i], color=color, alpha=.5, ls='--')
    h = ax.plot(s[:,i], color=color, alpha=.2, lw=2)
ax.format(xlabel='x', ylabel='y', title='Red noise with window and line fit')
Lagged correlation
This is facilitated with the covar, and
corr functions. These functions also support
autocorrelation and autocovariance. An example is coming soon!